
6,090 people in Cheshire East were claiming out-of-work benefits in October, the most since August 2024. Under-25s rose by almost a quarter in a year.
6,090 people in Cheshire East were claiming benefits mainly because they were out of work in October 2026. That is 2.4% of residents aged 16 to 64, and the highest monthly total since August 2024.
The Office for National Statistics published the figures on 17 November through nomis. The count is 640 higher than a year ago, a rise of 11.7%.
Young people are still rising fastest. 1,330 claimants were aged 16 to 24, up 255 on October 2025. That is the highest figure for the age group since August 2021.
September was revised down
When we reported September’s count last month, the borough total was 6,060. The ONS has now revised it to 5,975, which is 85 fewer. The under-25 figure for September moved from 1,340 to 1,320.
The ONS revises the latest month as late Universal Credit data comes in, so October’s figure may move in the same way next month. On the revised numbers, the count rose by 115 between September and October.
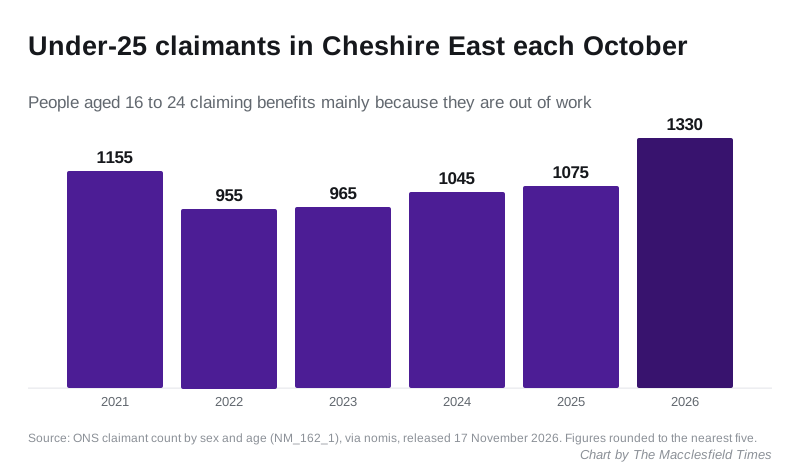
The chart shows the October figure for each year since 2021. This October’s count of under-25s is the highest of the six, and 175 above October 2021.
Every age group is up on a year ago
| Age | Oct 2025 | Oct 2026 | Change |
|---|---|---|---|
| 16 to 24 | 1,075 | 1,330 | +255 (+23.7%) |
| 25 to 49 | 3,070 | 3,275 | +205 (+6.7%) |
| 50 and over | 1,305 | 1,485 | +180 (+13.8%) |
| All ages | 5,450 | 6,090 | +640 (+11.7%) |
Male claimants rose from 3,080 to 3,465 over the year. Female claimants rose from 2,370 to 2,625. Most of the rise among under-25s is young men: 815 of the 1,330 are male, up from 655 a year ago.
All local claimant figures are rounded to the nearest five. The ONS publishes a rate only for all 16 to 64 year olds, not for each age group.
Still one of the lowest rates in the North West
At 2.4%, Cheshire East has the third lowest claimant rate of the 35 council areas in the North West. Only Ribble Valley and Westmorland and Furness are lower, both on 1.8%.
- North West: 4.2%
- England: 4.1%
- United Kingdom: 3.9%
- Cheshire West and Chester 2.7%, Warrington 2.7%, Trafford 3.0%, Stockport 3.1%
Over the county boundary, High Peak is on 2.5% and Staffordshire Moorlands on 2.1%. The highest rates in the region are Oldham on 6.7%, and Manchester and Rochdale on 6.1%.
What the number is, and what it is not
The claimant count is not the unemployment rate. The ONS says in its quality and methodology report that it “does not attempt to measure unemployment”.
- It includes some people who are working, because Universal Credit claimants on low earnings can be required to look for more work.
- It leaves out people who are out of work but not claiming.
What it means for you
The next release is due on 15 December, with November’s count and a revision to October.
If you are under 25 and looking for work in the borough, these do not need a Jobcentre appointment:
- Find a job lists vacancies by postcode, and apprenticeship vacancies can be searched the same way.
- The National Careers Service gives free advice by phone or webchat.
- If you already claim Universal Credit, report changes in earnings through your online account.
Sources
- ONS claimant count by sex and age, NM_162_1, via nomis (Cheshire East, E06000049; North West council areas; England and UK; October 2026 data and revised September, released 17 November 2026)
- ONS: Labour market overview, UK, November 2026 (release date 17 November, next release 15 December)
- ONS: Claimant Count Quality and Methodology Information
Have your say